Technical analysis is one of the most widely used methods in trading, helping traders make informed decisions based on historical price movements and market patterns. By analyzing charts, indicators, and trends, technical analysis provides valuable insights into potential future price movements. This article explores the concept of technical analysis, its importance, and how Diba Trader can help traders master this essential skill.
What Is Technical Analysis?
Technical analysis is the study of price movements and patterns in financial markets using charts and statistical tools. Unlike fundamental analysis, which focuses on economic factors and company performance, technical analysis relies solely on historical price data and volume to predict market behavior.
Why Is Technical Analysis Important?
- Identifying Trends: Technical analysis helps traders spot upward, downward, or sideways trends, enabling them to align their trades with market direction.
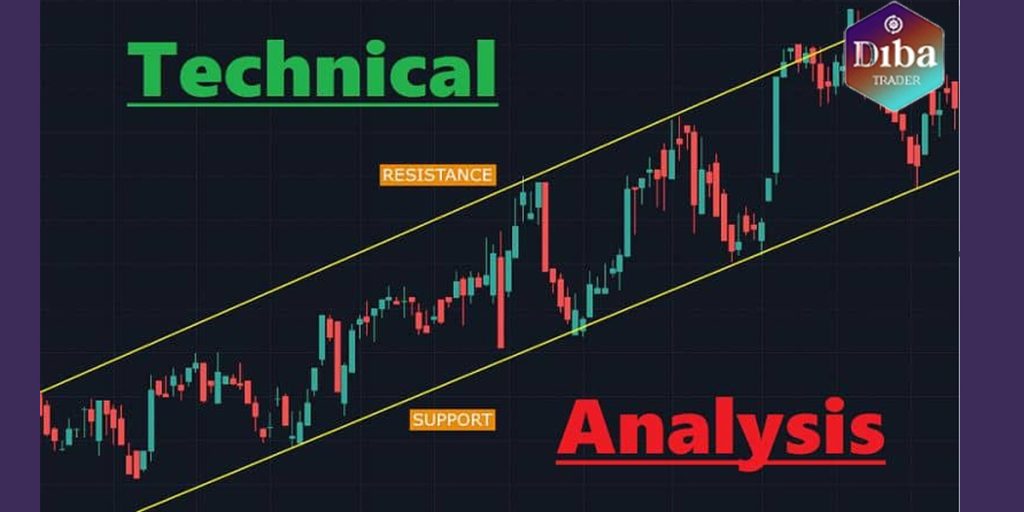
- Timing Trades: By analyzing key levels such as support and resistance, traders can determine the best entry and exit points for their positions.
- Predicting Market Behavior: Patterns and indicators provide clues about potential price movements, helping traders anticipate future outcomes.
- Universality: Technical analysis can be applied across various markets, including stocks, forex, cryptocurrencies, and commodities.
Key Tools and Techniques in Technical Analysis
- Charts:
- Line, bar, and candlestick charts are the primary tools used to visualize price movements over time.
- Candlestick charts are particularly popular due to their detailed representation of price action.
- Indicators:
- Common indicators include Moving Averages, Relative Strength Index (RSI), Bollinger Bands, and MACD.
- Indicators help traders assess momentum, volatility, and market strength.
- Support and Resistance Levels:
- Support levels indicate where prices are likely to stop falling, while resistance levels show where they may stop rising.
- These levels act as psychological barriers in the market.
- Chart Patterns:
- Patterns like Head and Shoulders, Double Tops, Flags, and Triangles provide insights into market sentiment and potential reversals.
- Volume Analysis:
- Examining trading volume helps traders understand the strength of price movements and confirm trends.
How Diba Trader Can Help with Technical Analysis
Diba Trader offers a range of services and resources to help traders master technical analysis and apply it effectively:
- Educational Resources:
- We provide tutorials, guides, and webinars to teach traders how to analyze charts, indicators, and patterns.
- Custom Tools:
- Our team develops tailored tools and indicators to suit your trading style and market preferences.
- Strategy Development:
- Diba Trader helps you design trading strategies based on technical analysis, ensuring they align with your goals and risk tolerance.
- Real-Time Support:
- Our experts provide real-time analysis and recommendations to help traders make informed decisions.
- Continuous Improvement:
- We offer ongoing support and training to ensure traders stay updated with the latest techniques and market trends.
By partnering with Diba Trader, traders can enhance their technical analysis skills, improve decision-making, and achieve consistent success in financial markets.
Conclusion
Technical analysis is a powerful tool for traders, providing insights into market behavior, trends, and price movements. With the right knowledge and resources, traders can use technical analysis to make smarter decisions and maximize their potential returns. Diba Trader’s expertise and support ensure that traders have everything they need to master technical analysis and thrive in today’s dynamic financial markets.